Friday, April 23, 2010

Bivariate Choropleth Map


Bivariate Choropleth Maps, as the name implies, depict the distribution or occurrence of a two variables across a map and how they are found together. It is exceedingly hard to find some of these not through someone else's blog when one looks for them.


http://www.geog.ucsb.edu/~jeff/gis/choropleth_maps_files/election04_vs_crime03b.jpg

Univariate Choropleth Map


Univariate Choropleth Maps are concerned with the occurrence of distribution of a single variable across the depicted area. This distribution of votes by county takes only one variable into account: voting.


http://kevinschulke.files.wordpress.com/2008/11/2008_election_map.jpg

Unstandardized Choropleth Map


Unstandardized Choropleth Maps use raw data as their basis of depiction. No other mitigating factors are accounted or adjusted for.


http://cber.utk.edu/census/2k/map2.gif

Standardized Choropleth Map


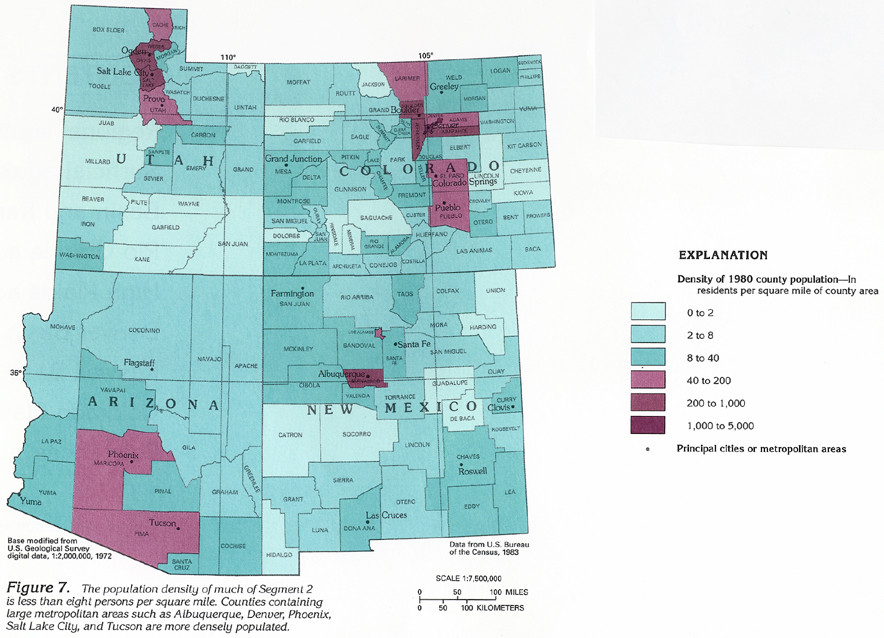
Standardized Choropleth Maps use data that have been averaged or otherwise manipulated so that one is no longer dealing with the raw numbers. Population per square mile by county, for example, shows how theses numbers don no account for county size of other factors.


http://pubs.usgs.gov/ha/ha730/ch_c/jpeg/C007.jpeg

Unclassed Choropleth Map


Unclassed Choropleth Maps use continuously graded scales to show information. There is a greater range of possibility for shade or color, and that shade or color will only exactly coincide when the data exactly coincides


http://www.esds.ac.uk/international/images/uchoropleth.gif.