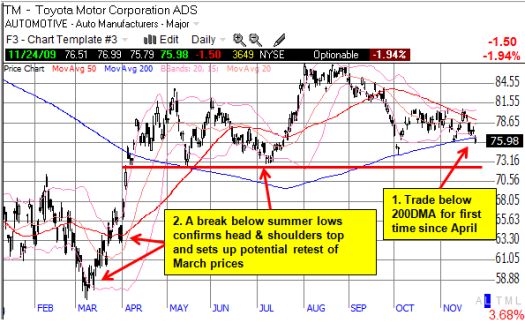
Index Value Plots are simple graphical depictions of a line on a graph derived from a body of data via a mathematical equation. It is, in short, an indexed graph. This graph of Toyota is a set of indexed values that makes sense to stockbrokers.
http://drduru.com/onetwentytwo/wp-content/uploads/2009/11/091124_TM.jpg
No comments:
Post a Comment